

Conventional tests measure the echo.
The Compass measures your inflammation profile.
The Compass does not replace hs-CRP or the CBC — it reports your inflammation profile from gene activity they were never built to record. Conventional markers remain essential, guideline-anchored integrators; the Compass adds mechanistic attribution and resolution visibility from whole-blood RNA.
Most inflammation markers in routine use read either a downstream consequence of alarm signaling — most often the liver's delayed reaction — or an upstream metabolic driver that fuels vascular inflammation without measuring it; direct cytokine assays catch the alarm itself only briefly. None reads the gene activity underlying the inflammation response in immune cells, none can see the resolution phase, and cell counters record numbers rather than functional states.
Acute-phase reactants
hs-CRP, ESR & ferritin: Downstream echoes
hs-CRP is a single protein manufactured by the liver, primarily in response to circulating IL-6. It begins to rise about 6 hours after alarm signaling, peaks around 48 hours, and has a plasma half-life of about 19 hours, which makes it a stable summary of systemic alarm activity.1 ESR measures red cell settling speed as a lagged fibrinogen proxy. Ferritin doubles as an iron-storage protein and acute-phase reactant, frequently confounding inflammation with liver health or iron stores. Crucially, none of these markers can measure whether active stand-down and resolution programs are running.
Hematology differential
CBC & NLR: Headcounts without orders
The Complete Blood Count with differential and derived ratios (such as the neutrophil-to-lymphocyte ratio, NLR) enumerate circulating leukocyte classes. While valuable for tracking immune shifts, a headcount cannot report functional state: a quiescent neutrophil and an actively degranulating one are counted the same on a standard differential.
Metabolic markers
ApoB & HbA1c: Upstream fuel, not response
ApoB, HbA1c, and fasting insulin measure the metabolic and vascular friction that can trigger inflammatory signaling. They sit upstream of the inflammation response: they indicate why a response might be initiated, but they cannot confirm whether an inflammatory response is actually active, localized, or resolving.
Serum cytokines
IL-6 & TNF-α: Signals that flicker in minutes
Directly assaying alarm cytokines captures the transient commands of the immune system. However, circulating IL-6 is cleared from plasma quickly,2 fluctuates with circadian rhythm and exercise, and varies between assay platforms. A single blood draw captures an unstable snapshot rather than the persistent transcriptional adaptation of immune cells.
Fatty-acid substrate
Omega-3 index: Substrate vs. active process
The omega-6:omega-3 ratio and omega-3 index measure red blood cell membrane fatty acids (EPA/DHA) — the raw material from which specialized pro-resolving mediators are synthesized.3,4 While valuable for indexing substrate availability, stocked shelves do not prove the kitchen is cooking. Membrane tests cannot measure whether active cellular resolution machinery is being transcribed.
The missing layer above conventional panels
The Inflammation Compass is designed to be reviewed alongside standard metabolic, lipid, and hematology panels. Upstream drivers (ApoB, HbA1c) show what is loading the system; acute-phase proteins (hs-CRP) integrate total systemic load; the Compass shows how circulating immune programs and resolution pathways are responding.
hs-CRP
One liver protein induced by IL-6
Downstream echo of the alarm
Rises ~6h, peaks ~48h, t½ ~19h
No tissue, cell, or resolution attribution
ESR
Red blood cell sedimentation rate
Lagged echo of the alarm
Days to rise, weeks to normalize
Confounded by anemia, age, and proteins
Ferritin
Iron-storage protein & acute-phase reactant
Downstream echo of the alarm
Peaks ~day 3–5, elevated for weeks
Confounded by liver injury, alcohol, and iron stores
CBC / NLR
Circulating leukocyte numbers
Cell numbers, not activity
Hours-scale snapshot
Reports counts; activation is visible only through indirect morphology flags
IL-6 / TNF-α
Serum cytokine signaling molecules
The alarm signal itself, briefly
Minutes to hours; diurnal shifts
Short-lived signal; varies between assay platforms
Omega-3 Index
Membrane fatty acid composition (EPA/DHA)
Substrate for Resolution
~Months (erythrocyte lifespan)
Measures substrate availability, not active resolution
Inflammation Compass
Whole-blood RNA expression + deconvolution
Activation and resolution pathways; repair and memory only in part
Hours to days (transcript turnover in circulating leukocytes)
No anatomical origin; RNA is not protein; shifts with circadian timing, exercise, and acute illness
Inflammation is not a disease.
It is a response that starts and ends.
Inflammation is the immune system’s coordinated response to infection, tissue damage, and other physiological stress. Sensor cells detect the trigger and release mediators, including cytokines and chemokines, which recruit and activate leukocytes to remove the trigger and clear damaged tissue. Resolution is an active, regulated process: pro-resolving mediators stop further recruitment, promote the clearance of spent cells, and return tissue toward homeostasis. The same machinery responds to infection, injury, vaccination, and strenuous exercise. Circulating immune cells take part in this signaling, so gene expression in whole blood reflects it. For a plain-language version, see Inflammation, explained.
An effective inflammatory response is proportionate to its trigger and self-limiting: it activates, resolves, and returns to a resting level above zero. The concern in chronic inflammation is failure to resolve, not activation itself. The report therefore shows positions against a reference group and gives no target to minimize.
- Activation starts a response
- 21 pathways: danger sensing, alarm cytokines, interferon signaling, recruitment and deployment of immune cells, clotting and complement.
- Resolution ends it
- 17 pathways: feedback and calming signals, regulatory T cells and repair signals, and the clearance of spent cells.
Conventional markers
Each reads one layer
Routine assessment relies on hs-CRP and ESR, with ferritin, blood-count ratios such as NLR and SII, and occasionally cytokine panels. hs-CRP and ESR are downstream acute-phase readouts; ferritin also reflects iron status; blood-count ratios count cells without describing their activity; circulating cytokines are short-lived. Each test is well established, and none directly reports resolution.
Inflammation Compass
Reads activation and resolution
Whole-blood RNA sequencing reads gene expression in circulating immune cells across activation and resolution pathways. It complements these tests and does not replace them, and a blood sample does not show where in the body inflammation is taking place.
Six readings.
No single overall score.
Each reading is a principal component of the pathway scores within one phase, calculated with fixed weights: three for Activation and three for Resolution. Five are level readings; one, Where the Fast Response Is Working, is a balance between two sets of pathways. The readings are statistical summaries, not six separate body functions, and a pathway can contribute to more than one. Each is compared with a reference group measured the same way. No composite or overall score is reported, because collapsing the readings would discard which part of the system differs.
Activation starts a response
- Activation Level
- The fast, built-in alarm. These signals raise fever, call in immune cells, and get a response started.
- Targeted Defense
- The targeted part of the response. These signals show a threat to T cells and power up the cells that kill marked targets.
- Where the Fast Response Is Working
- Where the fast response is happening: mainly in the blood, or moving cells out into tissue. This reading is a balance between two sets of pathways.
Resolution ends it
- Resolution Level
- The early brakes. Feedback and calming signals that keep a response from running on.
- Regulatory Cells & Repair Signals
- The longer-acting brakes. Regulatory T cells and repair signals that hold a response down over time.
- Clean-up & Rebuilding
- Spent immune cells are cleared away and the body shifts toward repair.
Results open from the six readings to the 38 pathways behind them, and from there to the genes. For each reading, the report says what higher and lower mean, and names the pathways behind any reading outside its range.
Two ways gene activity adds context
Read the readings for Activation and Resolution together, then examine the pathways behind each reading. These views add detail about immune-cell gene activity alongside protein measurements and cell counts.
Reading Activation and Resolution together
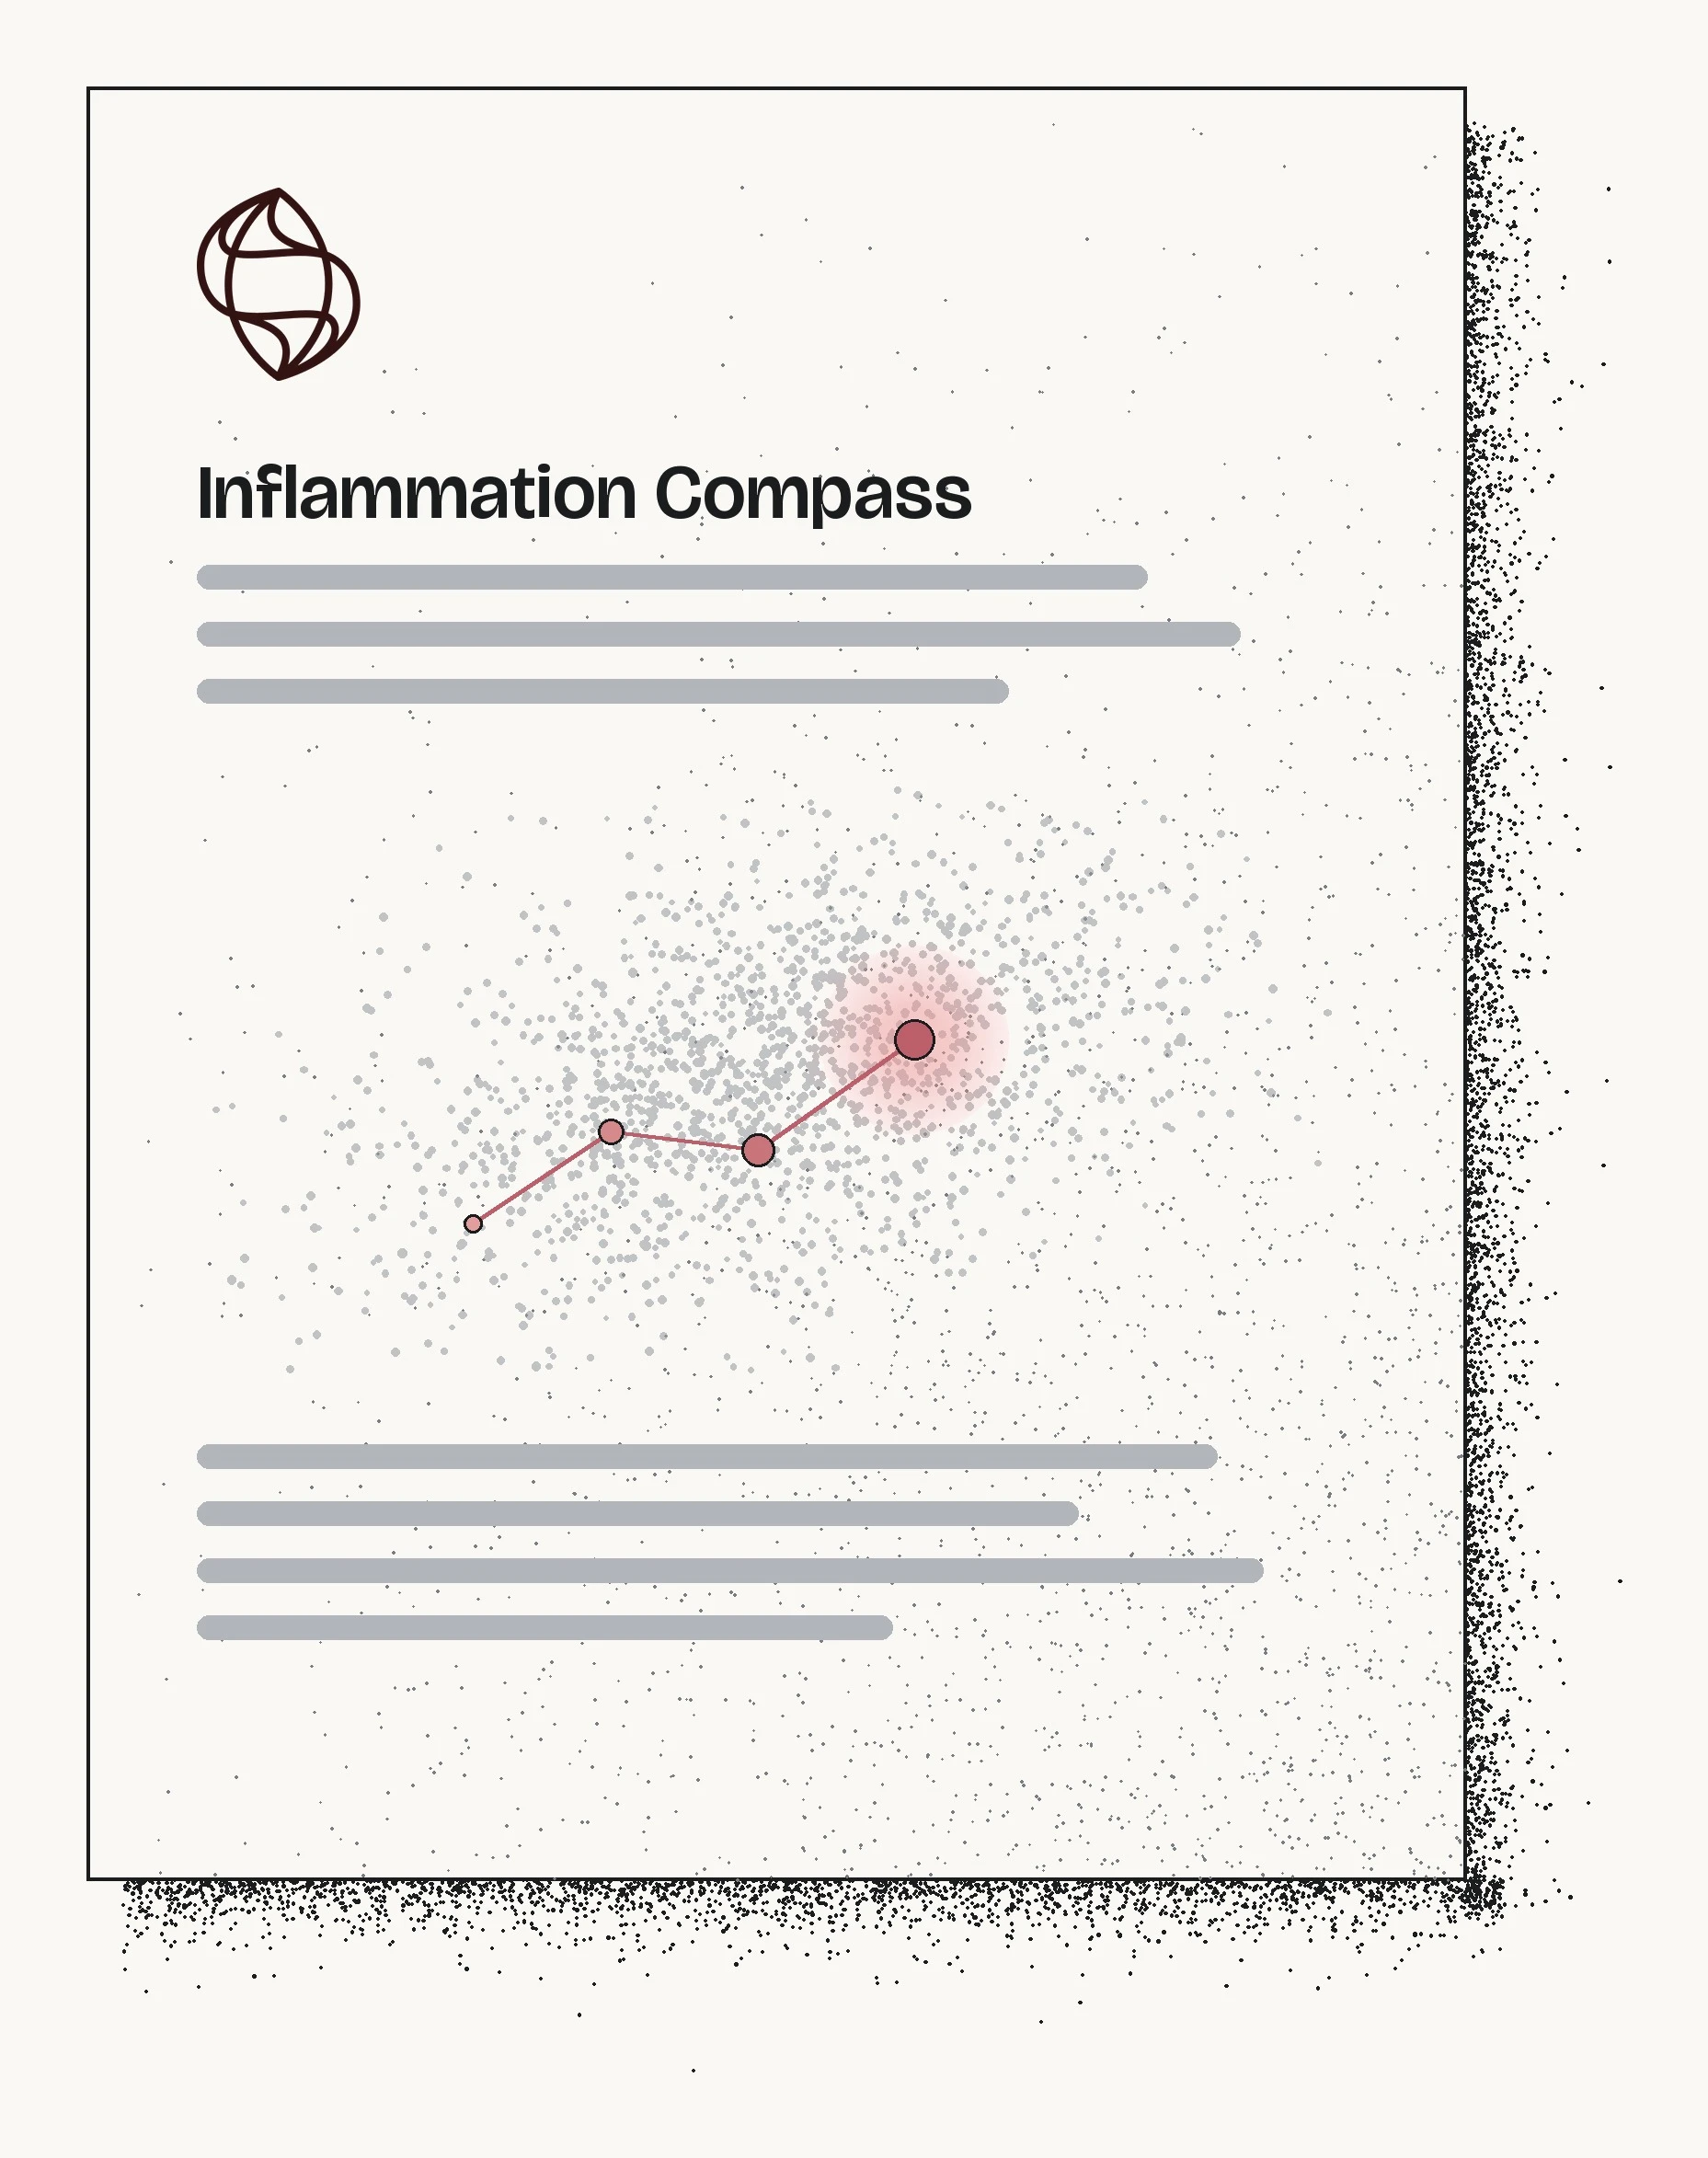
Reading the Activation and Resolution readings together shows both inflammatory activation and the activity of pathways involved in restraining the response, clearing debris, and supporting repair. On the report, Your Map plots Activation Level against Resolution Level across every sample, with the reference group drawn as the galaxy.
A higher Activation Level is not automatically adverse: a recent viral exposure, a vaccination, or a hard training block raises inflammatory signals as an expected acute physiological response.
Research on nonresolving inflammation and atherosclerosis describes the role of impaired resolution in disease biology.9,10
Cellular deconvolution: how many cells, and what they're doing
Standard bulk sequencing mixes signals across millions of circulating white blood cells. By applying reference-based cellular deconvolution algorithms to the same RNA sequencing data, the Inflammation Compass estimates relative immune cell proportions across major and minor leukocyte subsets.
This resolves the classic biological ambiguity: is a gene-expression rise driven by more cells, or the same cells running hotter? A Complete Blood Count measures the first term directly, but only across five broad leukocyte classes. The Compass estimates finer leukocyte composition and couples it with cell activation states from the same sample.11
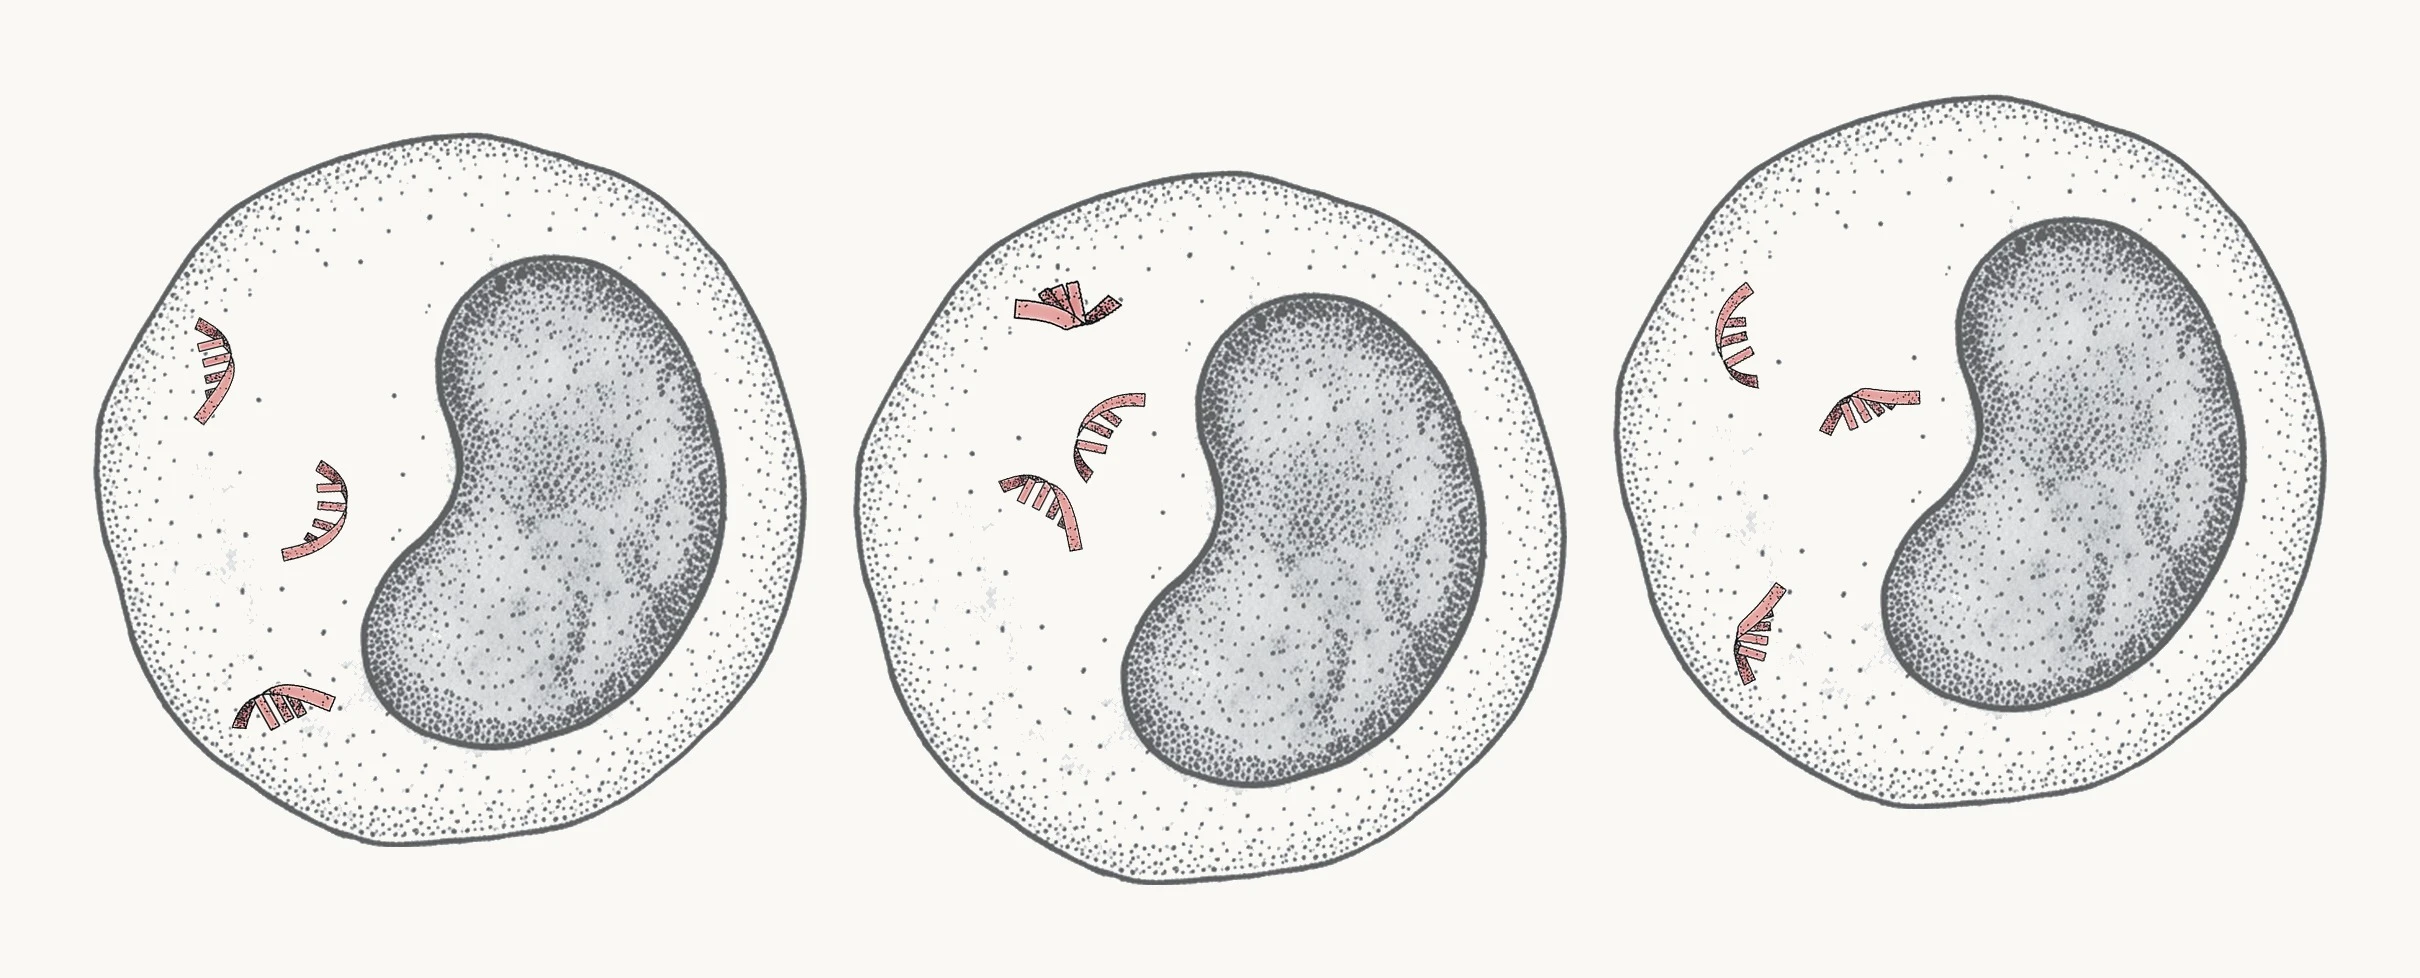
Before
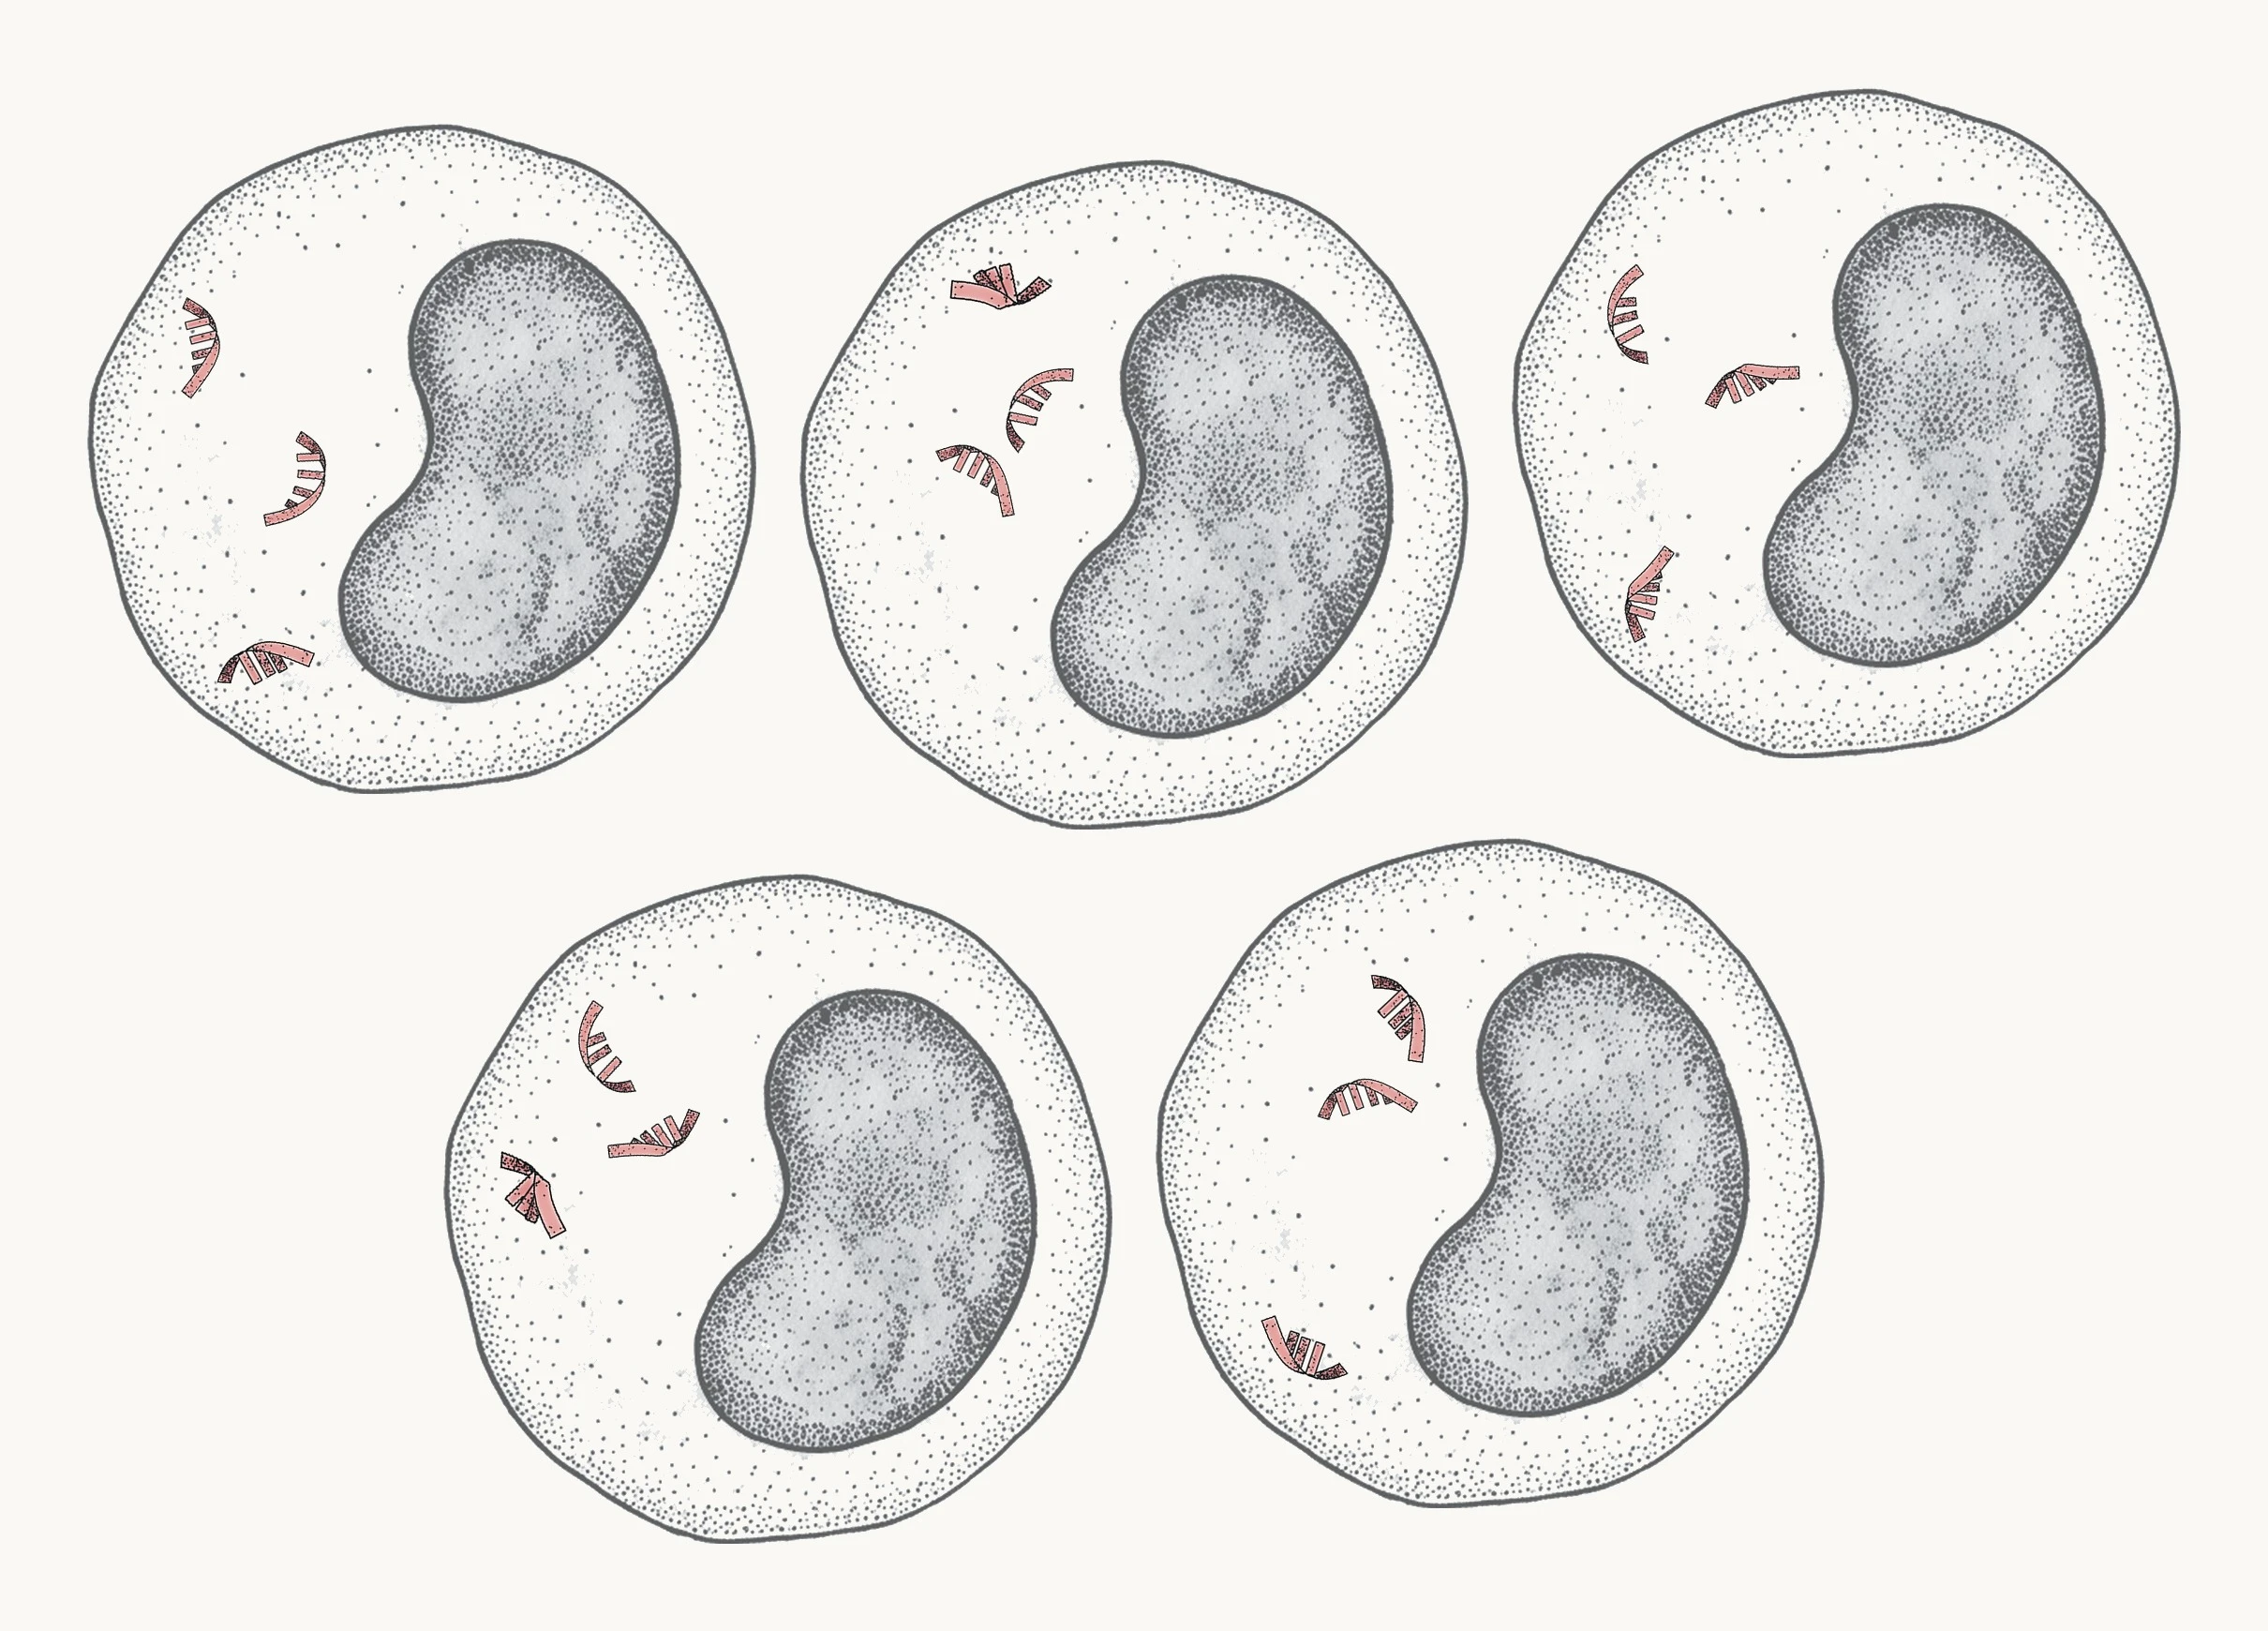
More cells, same activity in each
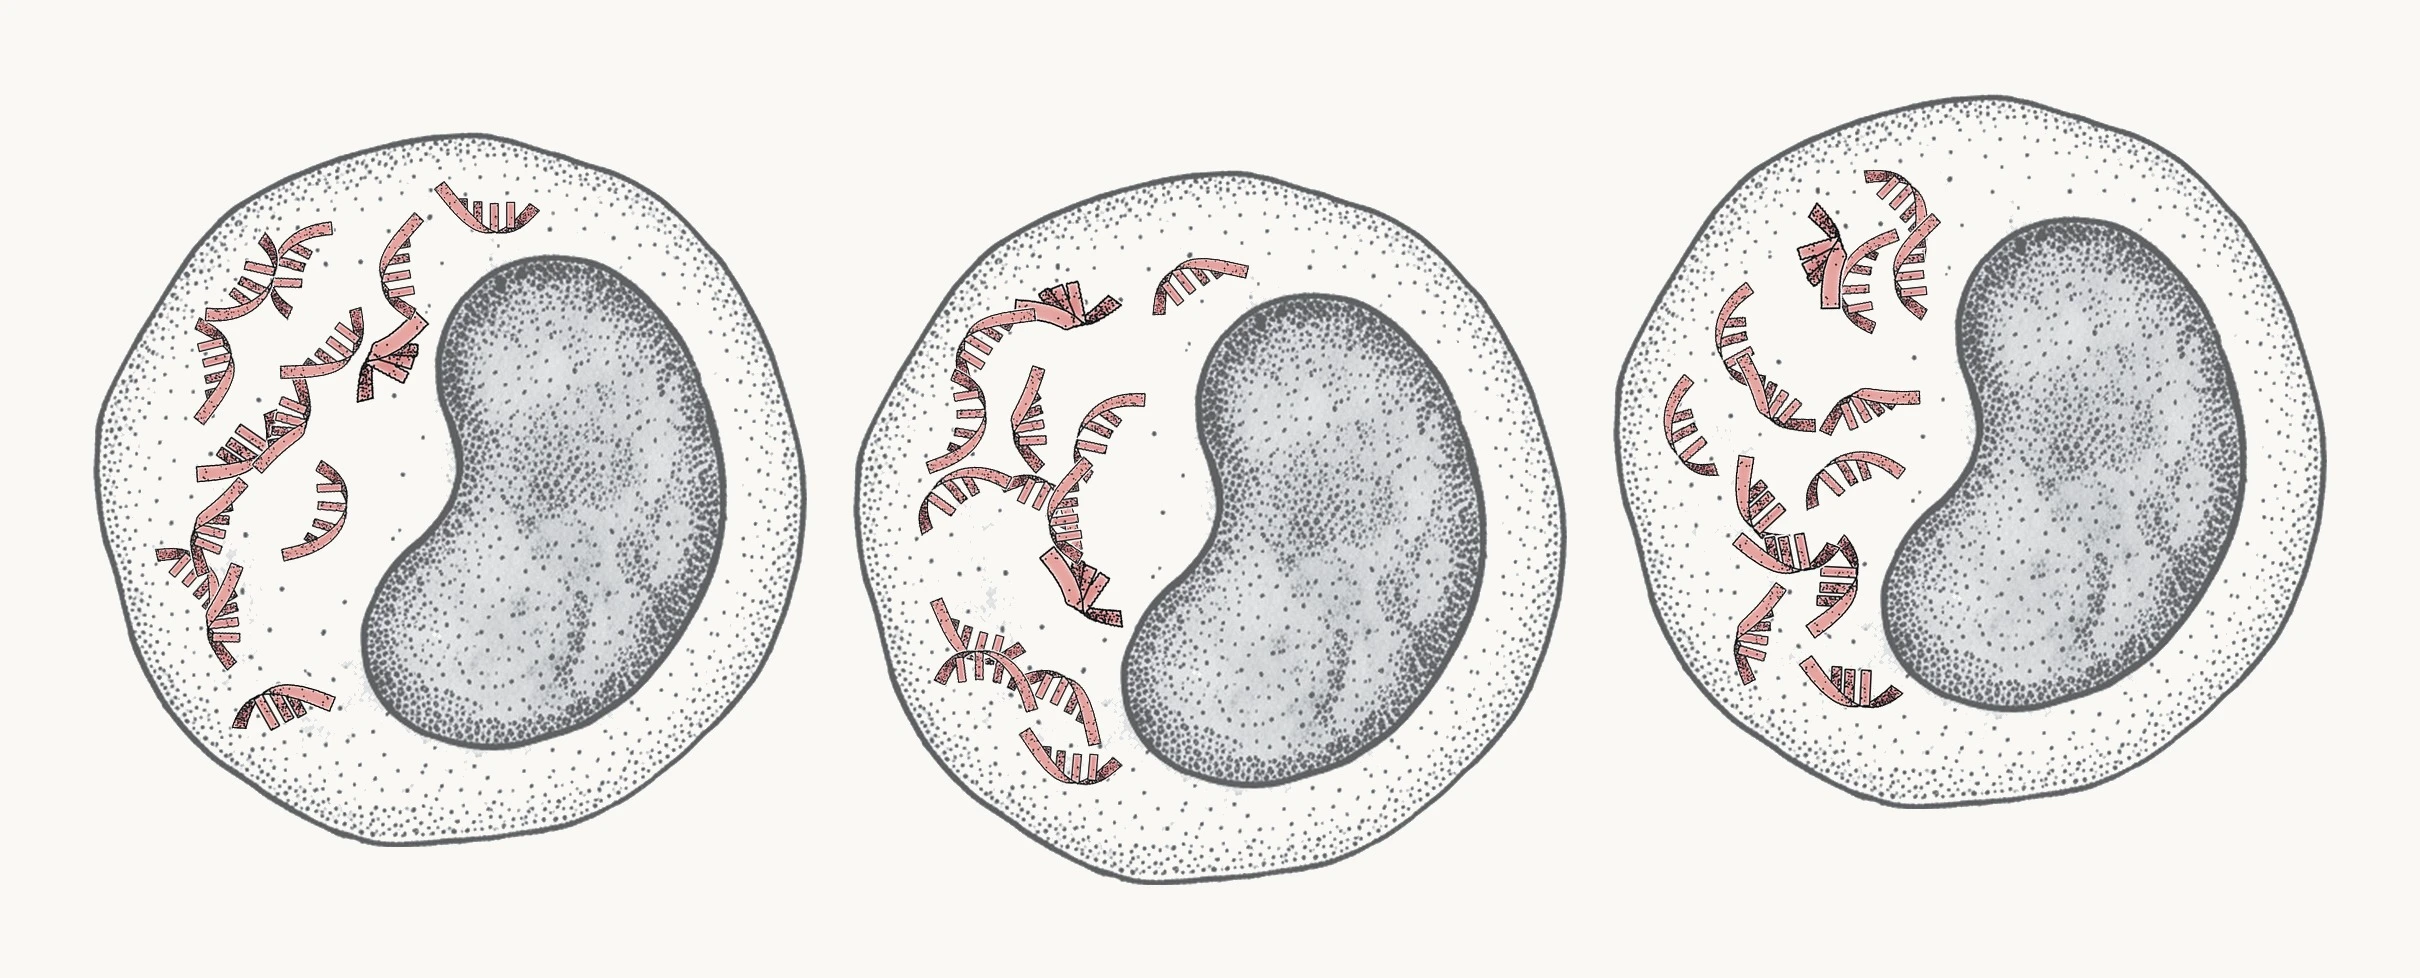
Same cells, each working harder
A compass, not a snapshot.
Film instead of a still photograph.
No two immune systems idle at the exact same baseline. Because gene expression fluctuates with circadian rhythm, exercise, and acute illness, a single test is a reference point. The true clinical value compounds across serial draws, where position transforms into direction and velocity of change. You choose the cadence; the timeline below is a suggested starting point.
Baseline
Establish your personal biological reference point across both phases, ideally before starting a new therapy or protocol.
1 Month
Capture early transcriptomic kinetics and observe initial shifts in innate signaling pathways.
3 Months
Evaluate whether early shifts consolidate, including myeloid calming and engagement of the Resolution phase.
12 Months
Maintain long-term surveillance, assess therapy adjustments, or monitor the inflammation cycle during medication tapering or discontinuation.
Core monitoring scenarios
GLP-1 therapy & off-ramps
Follow activation- and resolution-associated gene activity during GLP-1 therapy, maintenance or tapering. Review changes alongside weight and routine clinical measurements. The test does not measure lean mass or drug levels.
GLP-1 Monitoring HubPeptide & cellular regimens
Establish a baseline and follow how both phases change during peptide, cellular, or NAD+ protocols.
Peptide ProtocolsUnexplained hs-CRP
See which parts of the inflammation system are active when hs-CRP is higher than expected, or where the Resolution readings sit when hs-CRP is within its reference range.
What the test reports
From venous draw
to pathway-level evidence
The Inflammation Compass is executed as a high-complexity laboratory-developed test in Biomeme's CLIA-certified molecular laboratory in Philadelphia, PA. Every run undergoes rigorous molecular and bioinformatic quality gates.
PAXgene whole-blood RNA stabilization
Venous whole blood is drawn directly into a PAXgene Blood RNA collection tube containing proprietary chemical reagents that immediately lyse cells and stabilize intracellular RNA. This stabilizes the transcriptomic profile at the time of phlebotomy, minimizing ex vivo gene induction and transcript degradation during transit.12

Globin depletion & Illumina NovaSeq sequencing
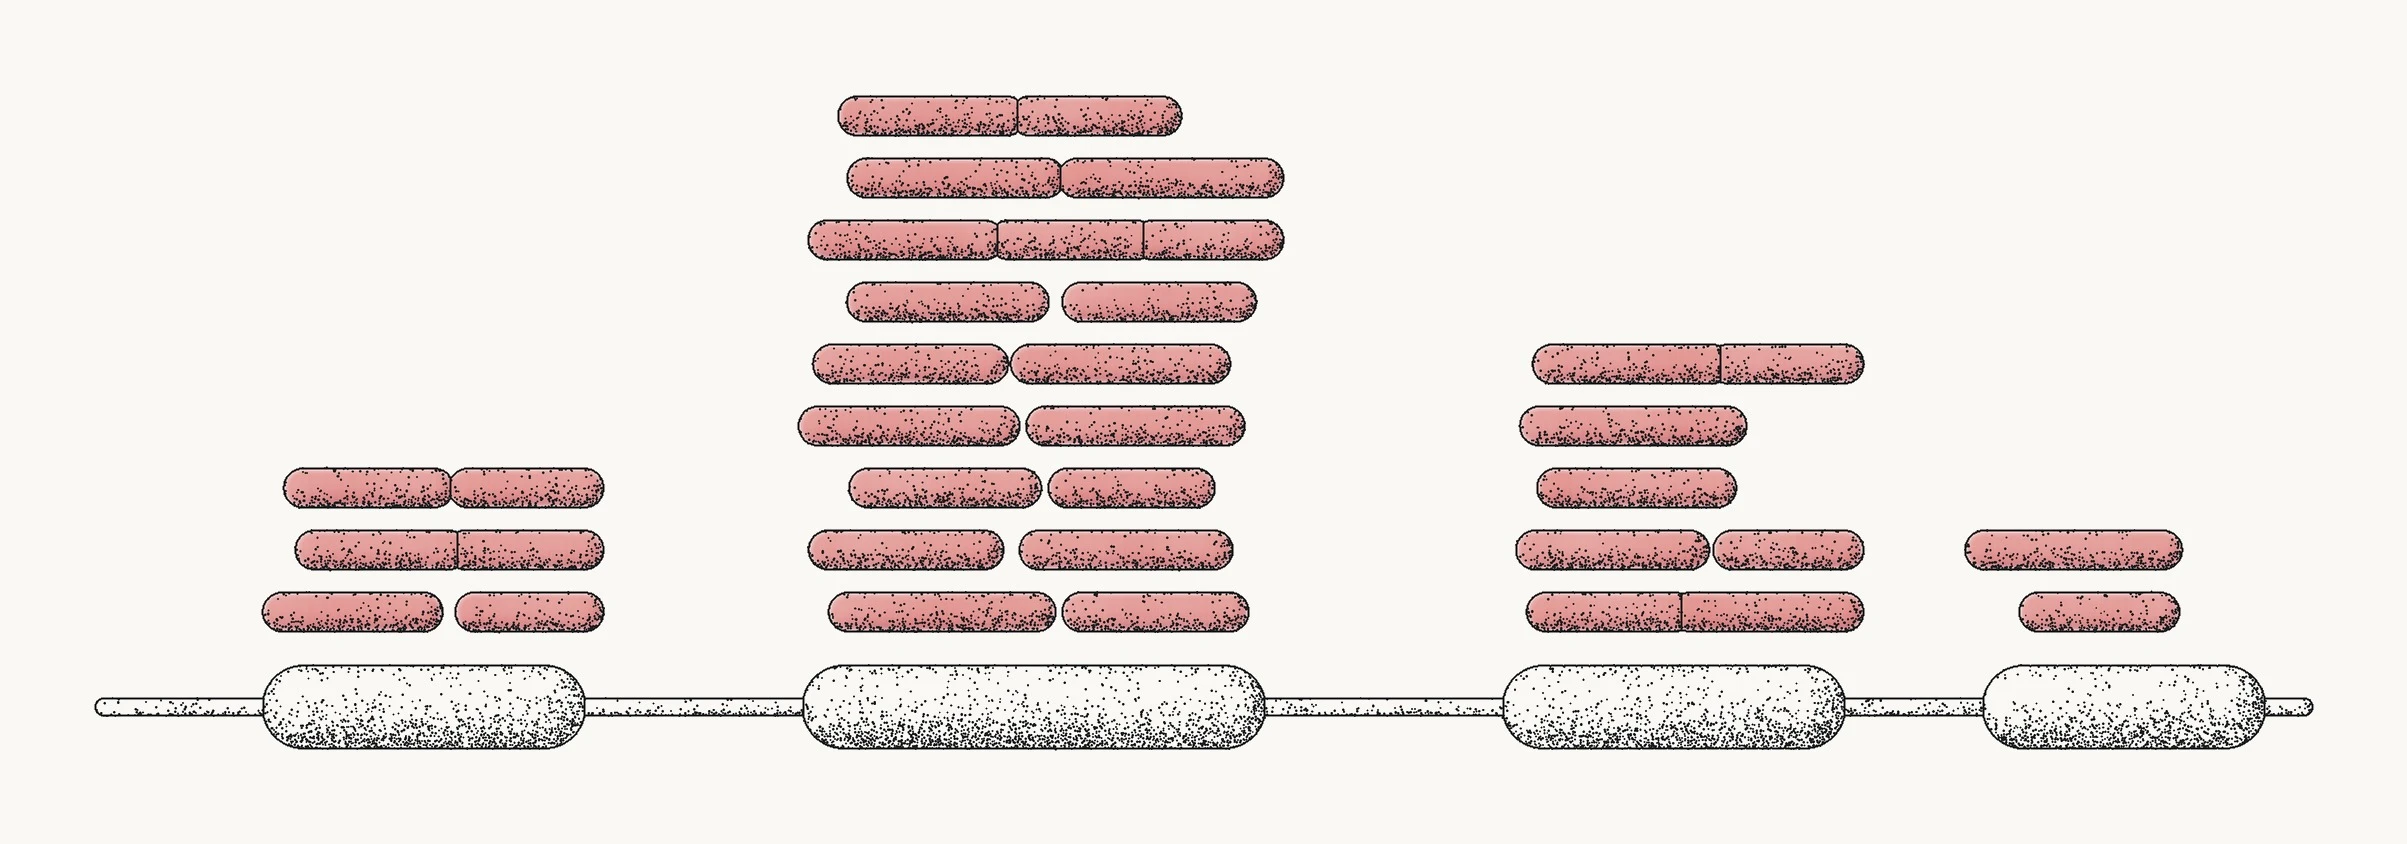
Following total RNA extraction and genomic DNA removal, red blood cell globin mRNA and ribosomal RNA are depleted to maximize sequencing depth across immune transcripts. Stranded cDNA libraries with ERCC spike-ins are sequenced on Illumina NovaSeq instruments at 2×150 paired-end reads, generating approximately 30 million read pairs per sample.
Bioinformatic alignment & pathway scoring
Raw sequence reads pass quality filtering, STAR alignment, and featureCounts quantification before TPM normalization. Expression data is scored across curated pathway gene sets, drawn from peer-reviewed research and pathway databases and checked against a reference collection of human blood transcriptomes.
Within-sample scoring & reporting
Each pathway result summarizes the collective activity of its genes relative to the overall gene activity in the same sample, so the sample serves as its own frame of reference and readings are robust to routine technical variation between sequencing runs. A statistical model with fixed weights combines the 38 pathway results into six readings, each compared with a reference group processed and analyzed with the same methods. Recorded method versions make the calculation method used for each draw traceable across repeat tests. Results are accompanied by a dedicated clinician report and a consumer interpretation summary.
What this measurement reports,
and where it stops
Scientific excellence requires defining analytical boundaries with the same precision as measured capabilities. The Inflammation Compass is designed around the following documented limits:
- · Systemic reflection, not anatomical origin: Circulating leukocytes carry the systemic reflection of inflammatory programs triggered throughout the body, but blood RNA cannot pinpoint the specific anatomical tissue or organ where inflammation originated.
- · Bulk averaging with deconvolution estimates: Whole-blood sequencing reads mixed cell populations. While deconvolution algorithms estimate cell type fractions, they remain computational estimates and rare immune subsets may have higher estimation variance.
- · Transcriptional activity vs. protein abundance: mRNA abundance reflects active genetic programming inside cells, which correlates with but does not perfectly mirror circulating protein concentrations or tissue receptor occupancy.
- · Temporal sensitivity: Gene expression shifts with circadian timing, intense physical training, acute viral infection, and sleep disruption. A single test is a biological snapshot; longitudinal repeat testing provides a more reliable trajectory.
- · Validation scope: The pathway gene sets are drawn from peer-reviewed research and pathway databases. Their response to changes in training, sleep or diet, or to therapies such as GLP-1 medications, is biologically expected but not yet demonstrated.
- · Regulatory classification: The Inflammation Compass is a laboratory-developed wellness test performed in a CLIA-certified laboratory. It describes patterns in gene activity. It does not diagnose, treat, cure, or prevent any disease, and is not cleared or approved by the U.S. FDA. It is intended for review with a licensed healthcare professional.
Establish your baseline inflammatory profile.
Reserve your spot for Inflammation Compass testing.
Terms used on this page
- Gene activity
- Gene activity describes which genes cells are using. This test measures that activity through RNA in your blood sample.
- Messenger RNA, or mRNA
- Working copies of gene instructions that cells make when they use a gene.
- RNA sequencing
- A laboratory method that reads RNA copies and matches them to the genes they came from.
- Transcriptomics
- The study of RNA across many genes.
- Pathway
- A group of genes involved in a biological process.
- Reading
- One of the six summary measures in the report, each covering a set of pathways from one part of the inflammation system.
- Immune cell mix
- An estimate, made from RNA, of the share of each kind of immune cell in your sample.
- Reference group
- The people your results are compared with, whose blood was measured the same way. On Your Map it appears as the galaxy. The reference range is where most of that group sits.
Sources and further reading
References
- Pepys MB, Hirschfield GM. C-reactive protein: a critical update. J Clin Invest. 2003;111(12):1805-1812. PMID 12813013. doi:10.1172/JCI18921
- Castell JV, Geiger T, Gross V, et al. Plasma clearance, organ distribution and target cells of interleukin-6/hepatocyte-stimulating factor in the rat. Eur J Biochem. 1988;177(2):357-361. PMID 3263918. doi:10.1111/j.1432-1033.1988.tb14384.x
- Harris WS, von Schacky C. The Omega-3 Index: a new risk factor for death from coronary heart disease? Prev Med. 2004;39(1):212-220. PMID 15208005. doi:10.1016/j.ypmed.2004.02.030
- Serhan CN, Savill J. Resolution of inflammation: the beginning programs the end. Nat Immunol. 2005;6(12):1191-1197. PMID 16369558. doi:10.1038/ni1276
- Ley K, Laudanna C, Cybulsky MI, Nourshargh S. Getting to the site of inflammation: the leukocyte adhesion cascade updated. Nat Rev Immunol. 2007;7(9):678-689. PMID 17717539. doi:10.1038/nri2156
- Shi C, Pamer EG. Monocyte recruitment during infection and inflammation. Nat Rev Immunol. 2011;11(11):762-774. PMID 21984070. doi:10.1038/nri3070
- Doran AC, Yurdagul A, Tabas I. Efferocytosis in health and disease. Nat Rev Immunol. 2020;20(4):254-267. PMID 31822793. doi:10.1038/s41577-019-0240-6
- Hinte LC, Castellano-Castillo D, Ghosh A, et al. Adipose tissue retains an epigenetic memory of obesity after weight loss. Nature. 2024;636(8042):457-465. PMID 39558077. doi:10.1038/s41586-024-08165-7
- Nathan C, Ding A. Nonresolving inflammation. Cell. 2010;140(6):871-882. PMID 20303877. doi:10.1016/j.cell.2010.02.029
- Fredman G, Tabas I. Boosting inflammation resolution in atherosclerosis: the next frontier for therapy. Am J Pathol. 2017;187(6):1211-1221. PMID 28527709. doi:10.1016/j.ajpath.2017.01.018
- Newman AM, Steen CB, Liu CL, et al. Determining cell type abundance and expression from bulk tissues with digital cytometry. Nat Biotechnol. 2019;37(7):773-782. PMID 31061481. doi:10.1038/s41587-019-0114-2
- Rainen L, Oelmueller U, Jurgensen S, et al. Stabilization of mRNA expression in whole blood samples. Clin Chem. 2002;48(11):1883-1890. PMID 12406972.